Did you know that you can navigate the posts by swiping left and right?
Setup Prometheus-Grafana Metrics With PM2 Clusters
27 Aug 2020
.
7 mins
:
tech
.
Comments
#OpenSource
#opensource
#linux
#programming
#nodejs
#tech
#tutorial
#devops
#monitoring
#prometheus
#grafana
#zealth-ai
#careshare
I recently had to setup metrics monitoring for a node.js application that I have been running using PM2 clusters. This article provides an approach to do the same and I believe should be helpful to anyone wanting to collect metrics and setup grafana dashboard for their application which uses PM2 as a process manager and runs in cluster mode.
PM2 is a daemon process manager that will help you manage and keep your application online 24/7
Before we begin, one should have basic idea about the meaning and usage of the following technologies and terms:
- Node.js and express
- PM2 process manager
- Metrics
- Docker
- REST API
- IP Address
The Issue
So, where does the problem lie? Why can’t we simply setup metrics for the application like any other node.js application metrics? We can if we want to use proprietary and paid tool; for instance pm2-io-apm, which is designed specifically for PM2. However, if you are like me and falling towards the opensource side, read further!
Instance refers to a single running worker of the application.
In PM2 clustering, all the instances of the application are running separately with PM2 as the master process, right? So, now when we sent a request to get metrics, PM2 allocates the request to a single instance which will provide us with it’s own metrics and not the aggregated metrics of all the instances that are currently running. This will give metrics of only one of the instance at a time and it’ll be changing randomly with every request made to the metrics endpoint. Isn’t that an issue?
Setting Up Metrics On An Instance Basis
The first step towards setting up metrics for our application, is installing the appropriate libraries. We’ll be using express-prom-bundle and graphql-metrics. Below is the code that is required to be setup for the express app,
I’ve only shown imports pertaining to the two libraries I’ve mentioned above, there could be other imports required as well.
import promBundle from 'express-prom-bundle';
import createMetricsPlugin from 'apollo-metrics';

const app = express();
// metrics for graphql requests
const apolloMetricsPlugin = createMetricsPlugin(register);
// metrics for rest requests
app.use(
    promBundle({
        autoregister: false, // disable /metrics for single workers
        includeMethod: true,
        includeStatusCode: true,
        includePath: true,
        promRegistry: register,
    }),
);
The important step here is using the same promRegistry for both the middlewares so that their metrics are together. Also, it is important to set autoRegister to False since we do not want the /metrics endpoint to be created by promBundle.
Middleware functions are functions that have access to the request object (req), the response object (res), and the next middleware function in the application’s request-response cycle.
Aggregating Metrics From All Instances
Now, since we have setup metrics on a per instance basis, we move on to the aggregation part. Remember we did not create the /metrics endpoint earlier? We will create it now and send aggregated metrics from all processes using the library pm2-cluster-prometheus. Following code is the updated code with the use of the library.
const app = express();
const aggregatorRegistry = new AggregatorRegistry();
// register for prometheus aggregation
app.get('/metrics', async (_, res) => {
    const metrics = await getAggregateMetrics();
    res.set('Content-Type', aggregatorRegistry.contentType);
    res.send(metrics.metrics());
});
// metrics for graphql requests
const apolloMetricsPlugin = createMetricsPlugin(register);
// metrics for rest requests
app.use(
    promBundle({
        autoregister: false, // disable /metrics for single workers
        includeMethod: true,
        includeStatusCode: true,
        includePath: true,
        promRegistry: register,
    }),
);
That’s it! Now the metrics that we get from /metrics is the aggregated metrics from all the instances using the default prometheus registry. This aggregation has a limitation that it can only aggregate from default registry and therefore cannot be used with libraries (for example swagger-stats) which don’t allow setting register and use their own register and endpoint.
A GitHub issue has been raised for swagger-stats regarding the same, #114
NOTE: I’m not sure about the fact that aggregation is only possible from default registry, however I’ve not found any example or documentation saying otherwise.
Setting Up Prometheus & Grafana
Having made available the aggregated metrics from our instances, it is time to setup Prometheus and Grafana. The process is very straighforward using dockprom. One should be familiar with how to install Docker and follow the instructions laid down in the readme for rest of the process.
dockprom is a monitoring solution for Docker hosts and containers with Prometheus, Grafana, cAdvisor, NodeExporter and alerting with AlertManager.
Once we have the docker containers running, we need to add the following configuration under scrape_configs in prometheus/prometheus.yml which would allow prometheus to pull metrics from our application.
- job_name: APP_NAME
scrape_interval: 5s
scrape_timeout: 5s
metrics_path: /metrics
scheme: http
static_configs:
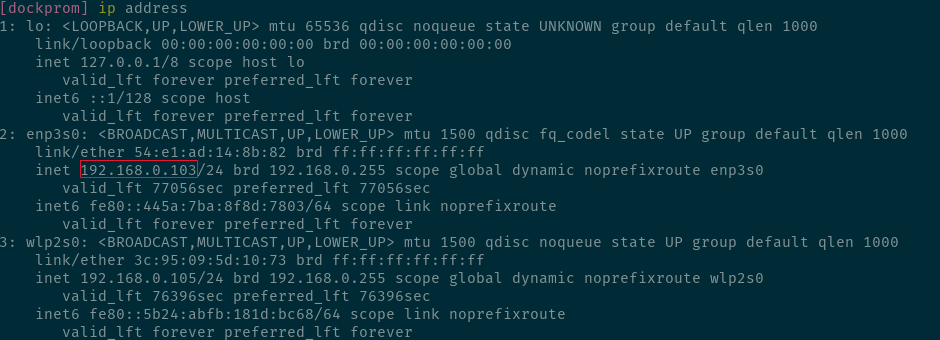
- targets: ['YOUR_INTERNAL_IP:5000'] // assuming application is running on port 5000
YOUR_INTERNAL_IP is the IP address of your machine which the prometheus docker-container can use to access the /metrics endpoint. This can be either your global IP address or the IP address alloted to your machine on the network. The command ip address when run in terminal gives the information about all the network devices and associated IP address. As an example, below is the address I would have put when running in my machine.
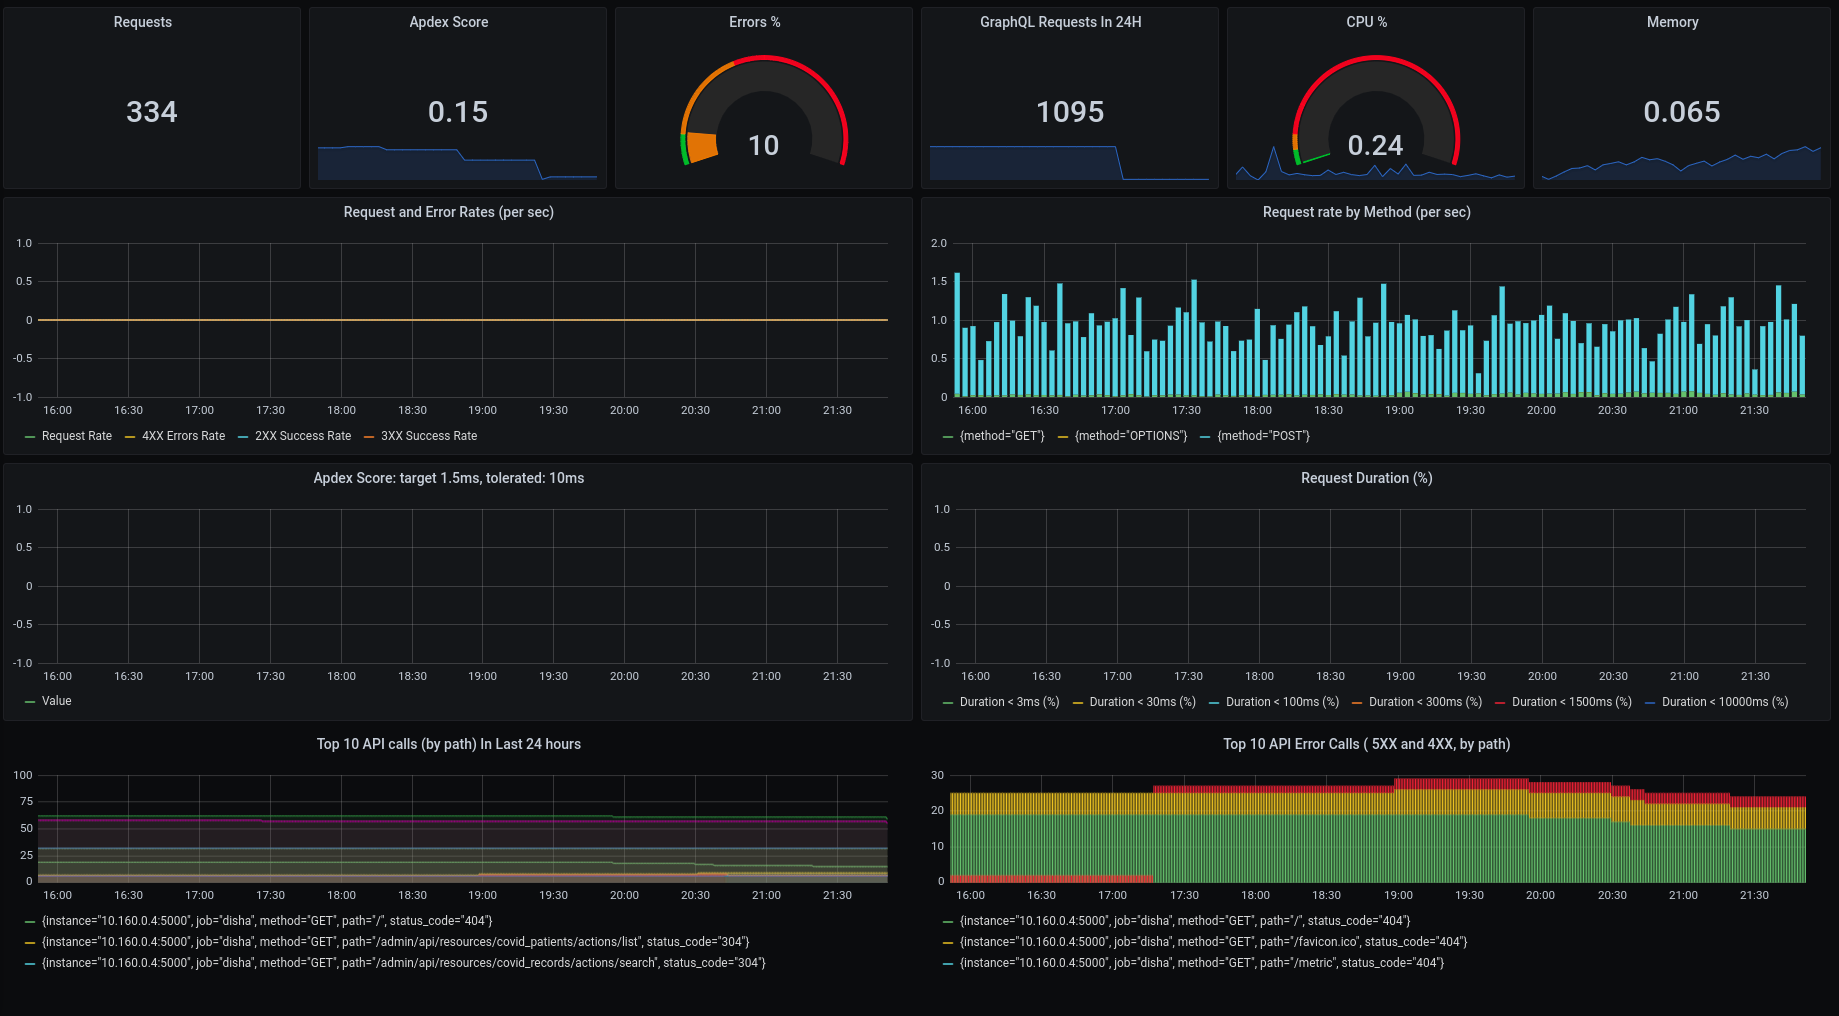
For Grafana, I’ve create a dashboard (shown below) which shows basic information about the application. You can find the configuration for the dashboard in this GitHub issue and download the JSON and add it in the folder grafana/provisioning/dashboards/.
Conclusion
There are multiple other methods to achieve the same, and some of them have been added in the next section. I tried almost all the existing methods before using aggregator as, unfortunately, none of them worked for me. If it is useful to you, which I believe it will be since you are using PM2 clustering, for resources level metrics I found pm2-prometheus-exporter really useful and it has a dashboard as well ![]()
Do give your feedback so that I can make the article much more useful and clear!
Be Kind First, Be Right Later
Other Approaches
Followings is a list of other approaches to the same problem:
- https://github.com/slanatech/swagger-stats/issues/29
- https://stackoverflow.com/questions/48436714/aggregate-metrics-in-child-workers-for-pm2-cluster-mode
- https://stackoverflow.com/questions/51118808/export-pm2-cluster-stats-to-prometheus

I'm intrigued by human psychology and code backend for videogames. I live with a philosophy to be simple, true, and kind always. I enjoy taking days slowly and writing when I learn something new - ah! that reminds me, I enjoy learning from new experiences a lot.